
Alloys do not have a melting point. Brass, stainless steel, and 6061 aluminum melt across a temperature range, yet most charts compress that range into a single number and move on. If you set a brazing, heat treatment, or casting temperature from that one number, you can miss the real process window by 50–100 °C (90–180 °F).
The chart below lists melting data for common pure metals and engineering alloys in °C and °F. It separates single melting points from solidus–liquidus ranges and notes where the values come from, so you can use the numbers in drawings, RFQs, and process planning with confidence.
What Melting Point Data Is Used For in Manufacturing
Melting data shows up wherever heat meets metal. Casting shops use it to set pouring temperatures, weld and braze procedures use it to define heat input limits, and heat treatment recipes use it to stay below the point where a part starts to melt locally.
For sheet metal work in particular, a material grade on a drawing is only useful once you know its thermal limits. The practical question is rarely “what is the melting point of steel.” It is “which temperature applies to my process, and what happens if I overshoot it.”
One Number or Two? How Pure Metals and Alloys Melt
Pure Metals: A Single Melting Point
A pure metal melts and solidifies at one equilibrium temperature. Hold pure aluminum at 660.3 °C (1220 °F) and solid and liquid coexist; add heat and the remaining solid converts at that same temperature. The number is a physical constant, which is why charts list one value.
Alloys: Solidus and Liquidus
An alloy melts across a range. The solidus is the temperature where the first liquid appears; the liquidus is the temperature where the last solid disappears. Between the two lies a mushy zone of coexisting solid and liquid.
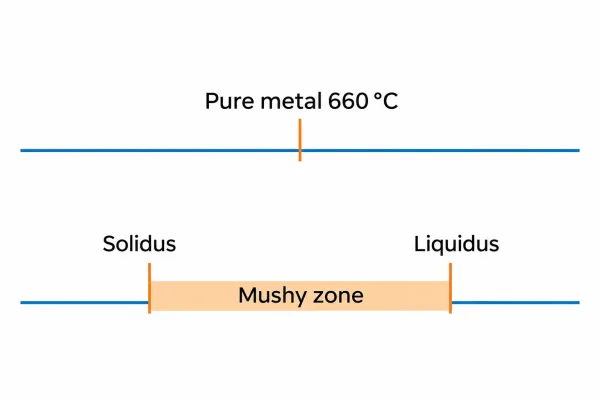
Pure metals melt at one temperature; alloys melt between the solidus and liquidus.
The width of that range depends on composition. A few tenths of a percent of carbon, zinc, or magnesium shifts both boundaries — which is why the same “family” name can cover meaningfully different temperatures.
Why Charts List a Single Value for Alloys
Most online charts quote one number per alloy: “brass, 930 °C” or “stainless steel, 1450 °C.” That figure is usually the liquidus, the solidus, or a rough midpoint, and it is rarely labeled. It is fine for ranking materials by heat resistance and misleading for anything else.
Before you use an alloy’s “melting point” to set a furnace or braze temperature, find the actual range. The tables below give that range for the grades that show up on sheet metal drawings.
Pure Metals: Melting Points in °C and °F
The table below gives equilibrium melting points for pure metals commonly found in fabrication and joining work. Values follow standard reference data (ASM Handbook Vol. 2).
| Metal | Melting point (°C) | Melting point (°F) |
|---|---|---|
| Aluminum | 660 | 1220 |
| Copper | 1085 | 1984 |
| Iron | 1538 | 2800 |
| Nickel | 1455 | 2651 |
| Titanium | 1668 | 3034 |
| Magnesium | 650 | 1202 |
| Gold | 1064 | 1947 |
| Silver | 962 | 1764 |
| Tin | 232 | 450 |
| Lead | 327 | 621 |
| Zinc | 420 | 787 |
These are reference values for the pure element, not for commercial grades. Iron at 1538 °C is the baseline for steels, but carbon and alloying additions pull the liquidus down — which is why commercial steel grades show ranges, not single points.
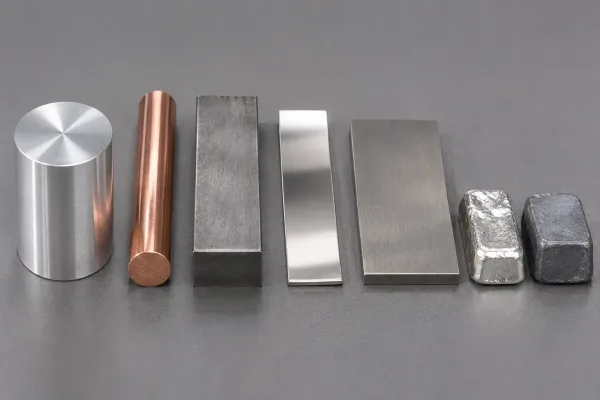
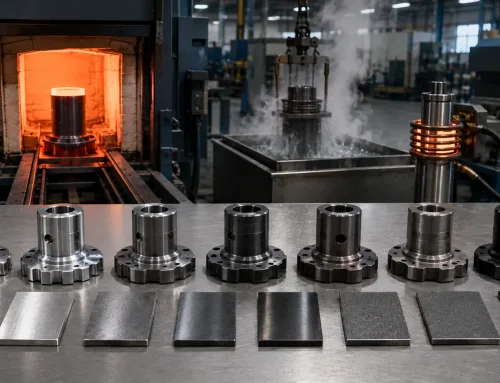
Reference specimens of pure metals commonly used in fabrication and joining.
Melting Ranges of Common Engineering Alloys
For alloys, plan with two numbers. The table lists approximate solidus and liquidus values for grades that appear on sheet metal drawings; treat them as typical ranges and confirm against the material certificate when tolerances are tight.
| Alloy | Solidus (°C) | Liquidus (°C) | Approx. range (°F) |
|---|---|---|---|
| Low-carbon steel (e.g., A36) | ~1450 | ~1520 | 2640–2770 |
| 304 stainless steel | ~1400 | ~1450 | 2550–2640 |
| 316 stainless steel | ~1375 | ~1400 | 2510–2550 |
| 5052 aluminum | ~570 | ~650 | 1060–1200 |
| 6061 aluminum | ~582 | ~652 | 1080–1205 |
| Cartridge brass (C260) | ~899 | ~940 | 1650–1725 |
| Phosphor bronze (C510) | ~900 | ~1000 | 1650–1830 |
Carbon and Stainless Steels
Carbon widens the melting range and lowers the liquidus relative to pure iron. Stainless grades add chromium and nickel back in, which shifts both boundaries again — 316 melts slightly lower than 304 because of its molybdenum addition.
For welding, what matters is that the base metal range sets the window the filler and the heat input have to work within. The heat-affected zone (HAZ), the band of base metal next to the weld whose properties change with the heat, never gets far from that window.
Aluminum Alloys
Aluminum alloys melt at much lower temperatures than steels, and many have wide ranges: 6061 starts to melt near 582 °C and finishes near 652 °C. The solidus is the critical number for heat treatment.
Solution treatment of 6061 runs around 530 °C — roughly 50 °C below its solidus — because exceeding the solidus causes incipient melting at grain boundaries. That damage shows up as blistering, cracking, or lost strength after aging, and it cannot be repaired.
Brass and Bronze
Copper alloys respond strongly to composition. Zinc lowers the melting range in brass, and leaded brass grades have depressed solidus values, so they are not candidates for high-temperature service or welding.
Bronze ranges overlap with brass, so always check the specific alloy designation on the drawing rather than the family name. Two parts both called “bronze” can differ by 100 °C at the liquidus.
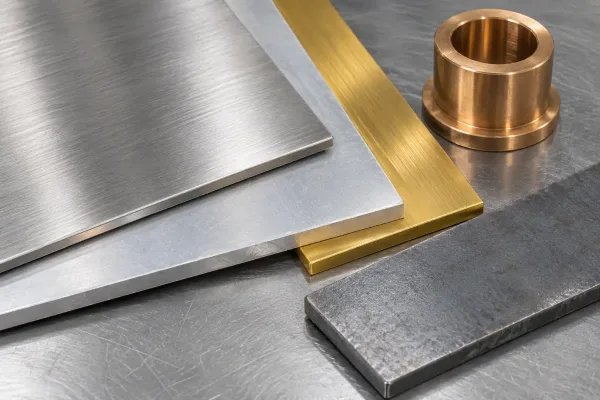
Engineering alloy samples whose melting behavior is defined by a solidus–liquidus range.
Where These Numbers Come From
Reference values above follow widely used industry sources: ASM Handbook Volume 2 (properties of nonferrous alloys) and Volume 3 (alloy phase diagrams), ISO material standards for wrought aluminum and copper alloys, and mill certificates (MTRs — material test reports) for the actual heats used in production.
Expect small differences between sources, typically 5–15 °C (10–30 °F). Commercial grades sit inside composition tolerances, and different standards round differently.
For a quotation or a process sheet, cite the standard or the certificate rather than a website chart. For a critical braze or heat treatment limit, use the MTR from the batch you will actually process.

A mill certificate and reference handbook — the sources behind traceable melting data.
What Melting Behavior Means for Sheet Metal Work
Laser and Thermal Cutting
Laser, plasma, and oxy-fuel cutting all rely on locally melting or vaporizing material, so melting point is one factor behind how much energy a cut needs. Steel takes more laser power than aluminum largely because it must be heated through a much higher melting range.
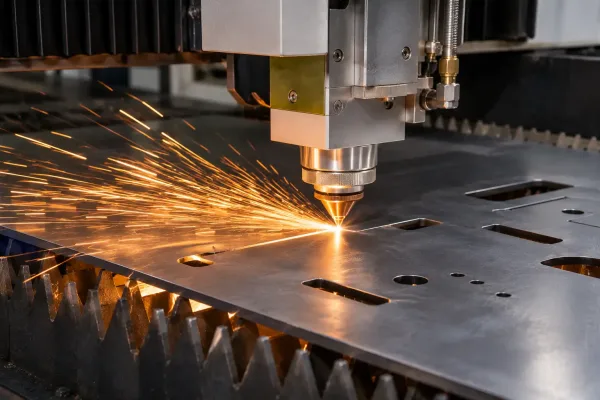
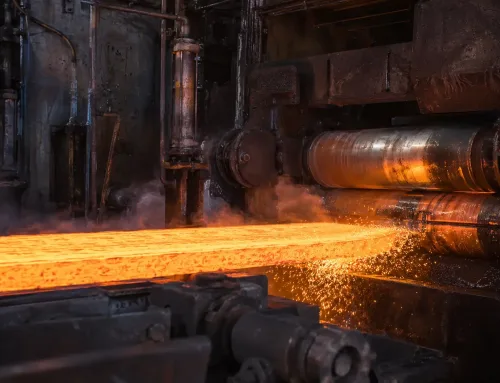
Local melting during fiber laser cutting of a steel sheet.
The chart sets expectations; the machine’s material library still sets the actual parameters. Melting point does not replace a cut test, but it explains why two “similar” materials behave differently on the same machine.
Welding and Brazing
Welding melts the base metal, so the heat input has to bridge the alloy’s liquidus locally. Brazing works on the opposite rule: the filler’s liquidus must stay below the base metal’s solidus, so the filler melts and flows without melting the part.
Getting that relationship backwards is the most common way a “brazed” joint becomes a welded, distorted one. When a drawing specifies brazing, the solidus of the base metal is the hard ceiling for filler selection.
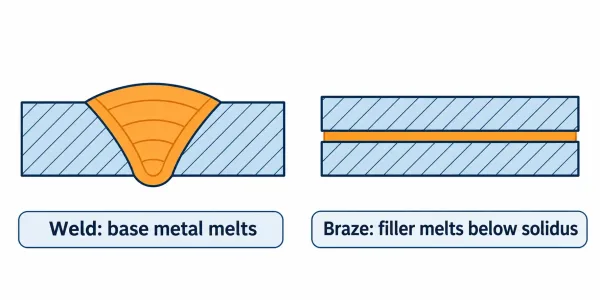
Welding melts the base metal; brazing melts only the filler below the solidus.
Heat Treatment: The Solidus Ceiling
Every heat treatment temperature is capped by the solidus. If the callout exceeds it, low-melting phases at grain boundaries melt and the part is scrapped — there is no safe margin above the solidus.
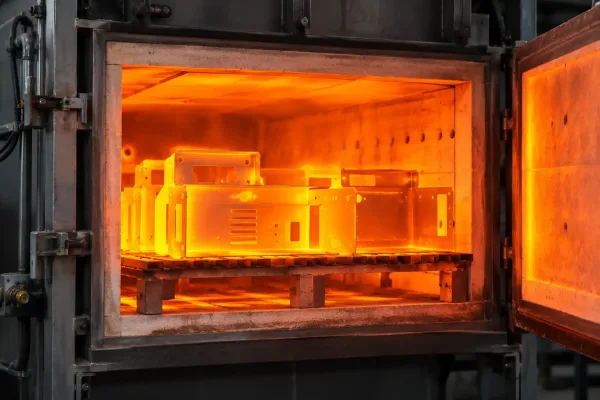
Heat treatment furnace temperature must stay below the alloy solidus.
When a drawing calls out a heat treatment with no temperature, the fabricator works backward from the alloy’s solidus. If the callout is tight and the thermal data is missing, that is a question to close during the RFQ (request for quotation) stage, not after production starts.
A Checklist for Reading and Applying the Chart
Use these rules when you pull melting data into a drawing, RFQ, or process plan:
- Match the exact grade, not the family name — “stainless steel” and “304” do not share one number.
- Treat pure metal values as single points; treat alloy values as ranges with two boundaries.
- Set heat treatment and brazing limits from the solidus, not from a chart’s single “melting point.”
- Use the liquidus only when the process needs full melt, such as casting or the weld pool.
- Expect 5–15 °C variation between sources; do not turn it into a tighter tolerance than the data supports.
- Cite the source — ASM reference, ISO standard, or mill certificate — wherever the number becomes a requirement.
- When a quote depends on thermal data you cannot trace, raise it before the order is placed.
If your next project depends on material or heat treatment assumptions you cannot verify from the drawing package, a manufacturability review before the RFQ closes the gap early.
FAQs