
Your customer’s supplier questionnaire now asks for the embodied carbon of the sheet metal enclosure you are specifying. Three materials sit on the table — mild steel, stainless steel, and aluminum — and the figures attached to each quote do not line up. One supplier quotes per kilogram, another per part, a third sends an EPD written for structural sections in buildings. “Which material is lowest carbon?” is the wrong first question. The useful question is: which material, produced by which route and used at which gauge, gives this part the lowest auditable footprint?
What follows is a selection framework for fabricated sheet metal parts — enclosures, brackets, panels, chassis — not for buildings. It covers what the metric counts at part level, how to compare materials on a defensible basis, what actually moves steel’s numbers, which design levers outperform the material field, and how to write the requirement into drawings and RFQs so a supplier can answer it.
What Embodied Carbon Means at the Part Level
Embodied carbon is the total greenhouse gas emissions released while extracting, processing, and manufacturing a material into a finished part, before that part ever enters service. For a fabricated sheet metal component, the material’s production dominates the figure. Industry guidance from the SE 2050 program puts steel mills at about 90% of the industry’s cradle-to-fabricator emissions; cutting, forming, welding, and finishing share the remaining 10%.
Where the Boundary Is Drawn
Two boundaries appear in practice. Cradle-to-gate covers raw material extraction through the mill gate — usually what a material EPD reports. The A1–A5 life-cycle stages (an ISO 14040 framework common in construction) add transport, fabrication, use, and end-of-life. For a buyer comparing sheet metal materials, cradle-to-gate figures are the working currency. Fabrication-stage emissions are worth tracking separately, because design choices move them.
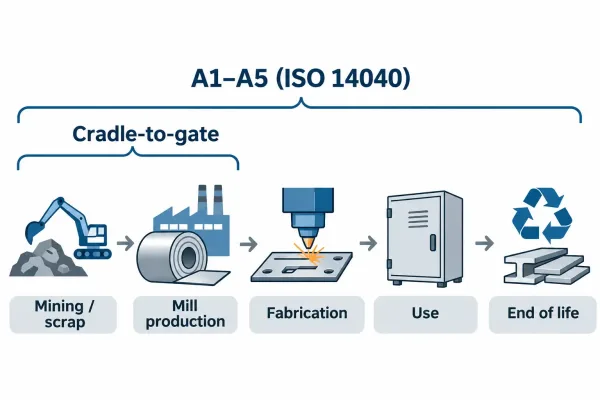
Cradle-to-gate covers extraction through mill production; A1–A5 extends from raw material to end of life.
The practical rule: never compare numbers drawn from different boundaries. A cradle-to-gate mill figure and a cradle-to-grave product figure do not belong in the same table.
Why Material Production Dominates
Because the mill stage is the largest single share, material choice matters more than any one shop-floor operation. But “material choice” is not a single variable. It is at least three: which alloy family, which production route and recycled content, and how much material the finished part actually uses. The rest of this article takes these in order.
Per Kilogram, Per Part, or Per Function: Choosing the Comparison Basis
Most published figures quote kilograms of CO₂e per tonne or per kilogram of material. That unit is valid at the mill and misleading at the part.
Why Per-Kilogram Figures Mislead
Primary aluminum typically carries a higher per-kilogram footprint than primary steel — often by a factor of two or more — because smelting is electricity-intensive. Aluminum’s density is about 2.7 g/cm³ against roughly 7.85 g/cm³ for steel. A bracket that must hold the same load can weigh less than half as much in aluminum. Compare per kilogram and aluminum loses. Compare per part at equivalent function and the gap narrows or reverses, depending on gauge and grade.
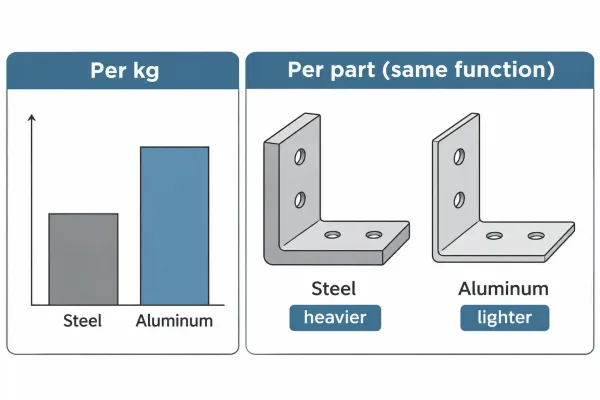
Per kilogram, primary aluminum carries a higher footprint than steel; per part at equal function, the gap narrows.
This is not a defense of aluminum. It is a statement about units. A carbon target without a stated basis is not verifiable.
What Lower Density Changes
Lower density is a design asset, not a marketing claim. Thinner-gauge aluminum can cut part mass, shipping weight, and in some assemblies the support structure around it. The engineering condition is stiffness and strength at the required thickness: if the part must jump to a much thicker gauge to control deflection, the mass advantage shrinks.
State the comparison basis in every document — per part, per assembly, or per unit of function — so that two suppliers’ numbers can be checked against the same question.
BOF, EAF, and Recycled Content: How Steel’s Footprint Is Decided
Within one alloy family, production route explains most of the variance. Steel is the clearest case, and it is the family most sheet metal buyers specify.
BOF and EAF in Plain Terms
Two routes dominate steelmaking. The blast furnace–basic oxygen furnace (BF-BOF) route reduces iron ore with coke and converts pig iron to steel, emitting CO₂ from both fuel and chemistry. The electric arc furnace (EAF) route melts steel scrap — sometimes with direct-reduced iron added — using electricity.
Published cradle-to-gate figures commonly place BF-BOF production near 2,500–3,000 kg CO₂e per tonne and high-scrap EAF production near 800–1,200 kg CO₂e per tonne — a spread of roughly three to four times. Where the electricity comes from shifts the EAF number further.
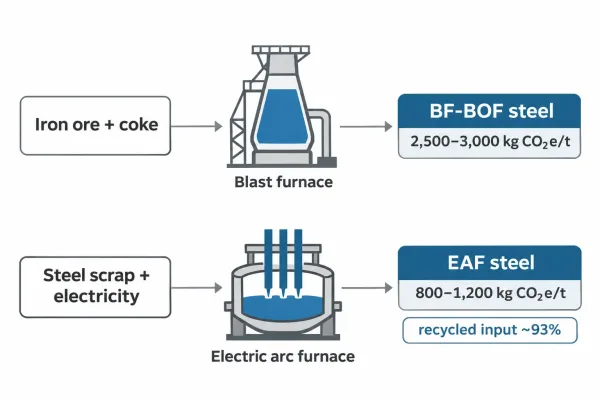
BF-BOF and EAF steelmaking routes and their typical cradle-to-gate emission ranges per tonne.
What Recycled Content Can and Cannot Deliver
Recycled content is the lever buyers can actually specify. EAF mills in North America run on average around 93% scrap input; BF-BOF mills have a practical scrap charge limit near 30%. EPDs have reported primary steel carrying up to five times the footprint of high-recycled-content steel in the same product family.
Two limits deserve attention. Scrap supply is finite, so recycled content alone cannot decarbonize steelmaking — some primary production will always be required. And stainless and specialty sheet grades have thinner scrap loops and heavier alloying demands, so the spread between routes is smaller than for plain carbon steel.
What to Ask for Instead of Taking a Claim on Trust
“Low-carbon steel” on a quote is not a specification. Ask for one of three things:
- an EPD (Environmental Product Declaration — a third-party-verified report of a product’s life-cycle emissions) covering the actual product form;
- the recycled content percentage, with the standard it is declared against;
- a mill certificate (such as an EN 10204 3.1) that identifies the heat and the producing route.
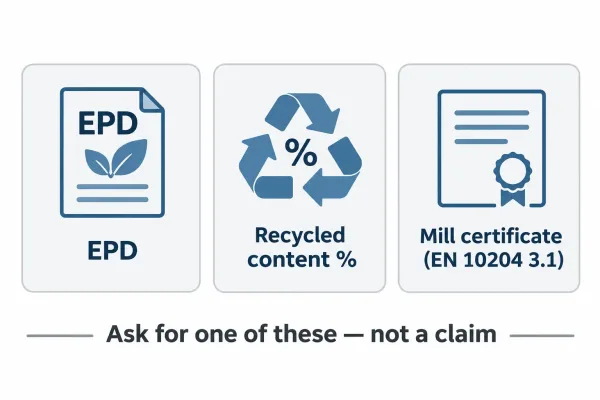
Three verifiable documents a buyer can request instead of accepting a low-carbon claim.
Numbers vary between producers and even between heats of the same grade. The correct expectation is a range with a documented basis, not a single universal figure.
Design Levers That Outweigh the Material Field
On many parts, the largest reduction available is not a different alloy. It is less material and fewer operations in the design already on the table.
Gauge, Strength, and the Function Your Part Must Keep
Strength-to-weight is the first lever. A high-strength grade at a thinner gauge can replace a mild grade at a thicker one — less mass per part, lower material emissions per part, with the same load path. The engineering checks are bend radius, springback, and flatness at the new gauge; a thinner part that needs extra stiffening features or tighter flatness control can give the savings back in operations. Reduce gauge only against a stated function: load, stiffness, or shielding.
Yield and Nesting: The Footprint of Your Cutting Plan
Every part is cut from sheet or coil, and the material that falls between parts is still embodied carbon with no function. Nesting yield — the share of the sheet that becomes finished parts — moves the material consumed per good part directly. At 70% versus 85% yield on the same order, the difference is roughly a fifth more material per part at the lower yield. Part outline, grain direction, and common-line cutting compound across a production run.
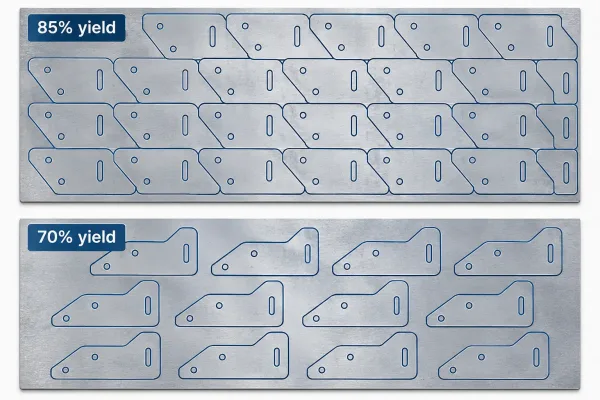
Nested cutting layouts at 85% and 70% yield; the difference is material consumed per good part.
When comparing materials, compare them at the nesting yield your supplier can actually hold, not at theoretical sheet utilization.
Fewer Joints and Operations
Welds, fasteners, and secondary operations add material and add emissions — consumables, hardware, rework risk, and handling. A folded tab-and-slot design that replaces a welded assembly saves weld wire, fixture time, and often distortion correction. Where welding stays, fewer and shorter seams reduce all three. Designing joints out is often a larger carbon decision than switching alloys, and it usually improves cost and lead time at the same time.
Writing Carbon Requirements Into Drawings, RFQs, and POs
A carbon target that cannot be verified at goods-in is a slogan. The fix is language a fabricator can quote against.
What Is Verifiable Versus What Is a Slogan
A verifiable requirement names a product form, a metric, and a document. For example: “Recycled content ≥ 60% by mass, declared to ISO 14021, with EPD or mill certificate at shipment.” A slogan says “use sustainable materials” or “minimize carbon” with no metric and no proof.
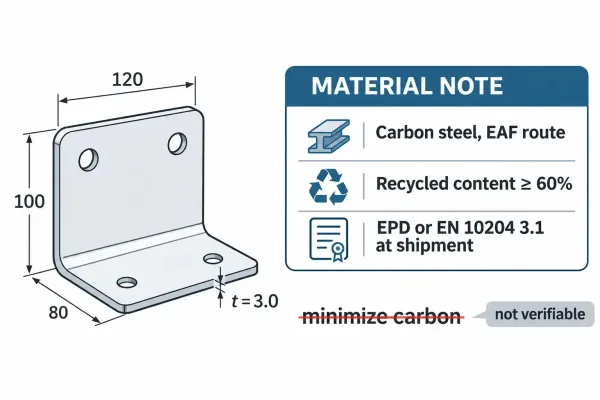
A verifiable carbon requirement names the route, the metric, and the document; a slogan does not.
Two more rules keep the comparison honest. Specify the route you need — EAF steel where the application allows it — rather than a number the supplier cannot source. And state the boundary (cradle-to-gate or A1–A3) explicitly, so quotes arrive on the same basis.
A Minimal Pre-RFQ Check
Before the RFQ goes out, confirm five points:
- Material grade and gauge are on the drawing.
- The comparison basis is stated — per part or per assembly.
- The recycled-content or EPD requirement is written as a checkable line, not a preference.
- Substitution rules are explicit: allowed or not, and on whose approval.
- The verification document is named (EPD, mill certificate, or both).
This is the same discipline a supplier applies when clarifying a drawing. The earlier it is written, the fewer clarification loops later. It is also the point where an engineer’s material-and-gauge choice and a buyer’s carbon target either agree or quietly conflict — settle it on the drawing, not in the inbox.
A Selection Framework for Your Next Sheet Metal Order
The decision sequence that follows from the sections above is short:
- Reduce material first. Right-size the gauge and the part count before swapping alloys.
- Choose the route and recycled content the application allows. For carbon steel, specify EAF and recycled content where the grade list permits.
- Compare per part or per function, never per kilogram alone. Record the basis on the drawing.
- Leave a document trail. EPD or mill certificate requirements belong in the PO, not in an email after shipment.
The table below condenses the variables for the three families most common in sheet metal work.
| Material family | Per-kg trend (primary) | Part-level note | What to specify | What to verify |
|---|---|---|---|---|
| Mild / carbon steel | Lowest of the three; wide spread by route | Dense — mass adds up; gauge dominates | EAF route; recycled content % | EPD or mill cert + recycled declaration |
| Stainless steel | Higher than carbon steel; smaller route spread | Corrosion class can allow thinner gauge; scrap loop different | Grade (e.g. 304/316); recycled % | EPD; EN 10204 3.1 |
| Aluminum | Highest per kg (primary); secondary is a fraction | Density ≈ 1/3 of steel — mass drops at equal function | Primary vs secondary; alloy | EPD; recycled content declaration |
Figures are typical industry ranges from published EPDs and guidance; actual values vary by producer and product form. Use the table for decision order, not for quoting a carbon number.
This framework applies to fabricated sheet metal parts. Building-level assessments and structural sections follow their own conventions and their own EPD categories.
If you are specifying materials for a sheet metal part and want the requirement checked against what a fabricator can actually source and certify, send the drawing and the requirement together. An early review is cheaper than a clarification loop.
FAQs