
The term usually shows up on a supplier’s quality report or a buyer’s questionnaire, and the instinctive reading is simple: the parts passed inspection, so the process is capable. That interpretation mixes up two kinds of evidence: inspection results describe parts that already exist, while process capability describes the process that made them — and forecasts what it will do next.
What Process Capability Actually Measures
Process capability is the ability of a stable manufacturing process to keep producing parts within its specification limits. Both halves of that sentence matter.
Specification limits are the upper and lower acceptable values for a measurable characteristic — a hole position, a bend angle, a wall thickness — as defined on the engineering drawing. A stable process is one whose average and spread stay consistent over time, with no uncontrolled shifts or trends.
Capability is a property of the process, not of an individual part or a single lot. It is estimated from measurement data collected under normal production conditions and is usually summarized by indices such as Cp and Cpk. In practice, the number answers one question: if the process keeps running as measured, how much of its output will fall outside the limits?
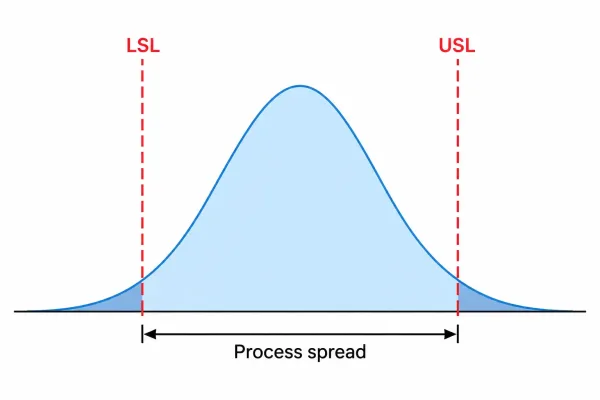
A normal distribution of part measurements between LSL and USL, with shaded tails showing where out-of-spec parts would fall.
Where the Variation Comes From
No two parts come off a manufacturing line identical, even with the same program and material specification. That spread is process variation, and it is the raw material of every capability calculation.
Material arrives within mill tolerances, so coil hardness and thickness vary from batch to batch. Machines have finite repeatability: a press brake returns to angle slightly differently as tooling wears, and cut edges shift with beam condition and heat buildup. Setups, operators, and shop temperature add smaller contributions. In sheet metal work, springback after bending and distortion from welding sequence repeat part after part.
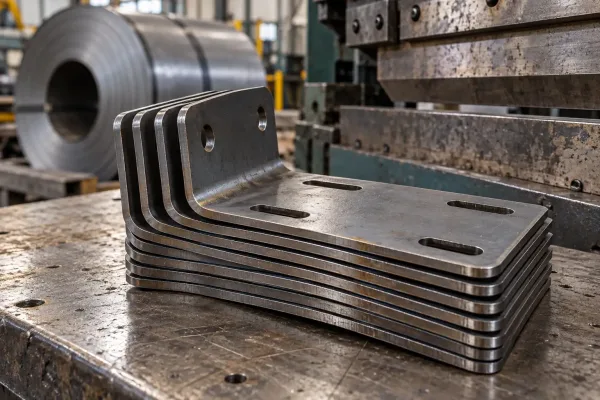
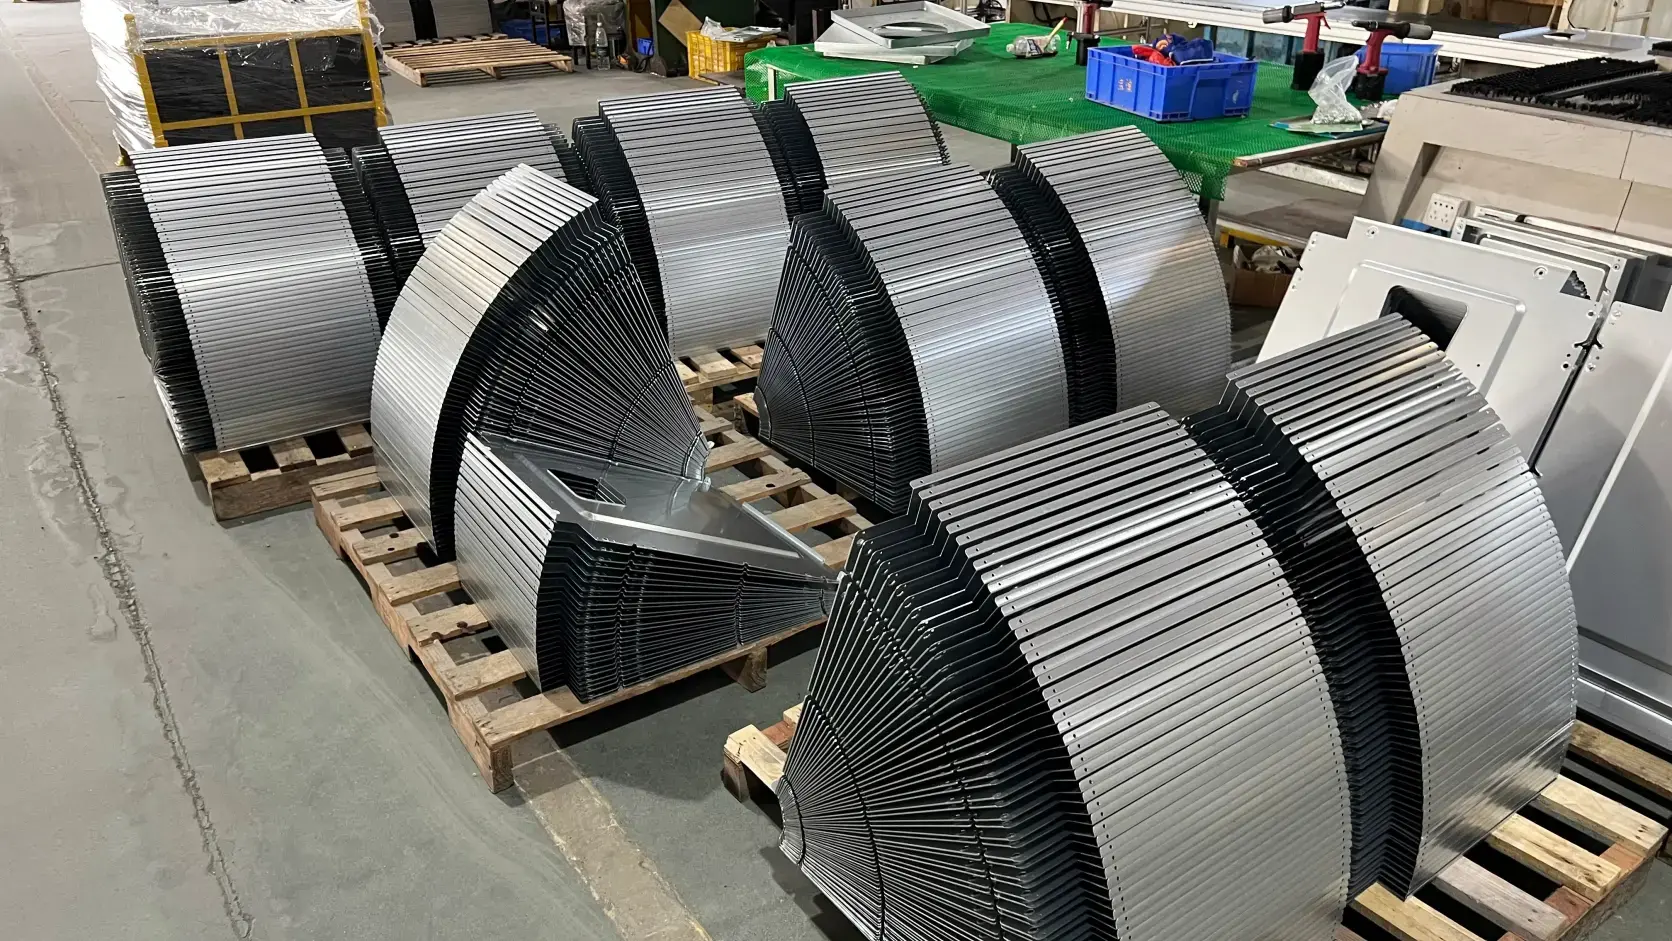
Identical brackets from the same drawing, where dimensional differences come from material batches, tooling wear, and bending springback.
Variation You Design Around vs. Variation You Must Remove
Not all variation deserves the same response. Some is inherent and must be designed around — centered, tolerated, and budgeted for at the drawing stage. Some comes from assignable events such as a loose fixture or a bad gauge, and it must be eliminated before any capability question can be answered. Knowing which is which comes first.
Specification Limits Come From the Drawing
Specification limits are an engineering requirement, not a statistical output. They exist because a designer decided how much a feature may vary and still fit, seal, fasten, or load correctly. Statisticians compare against those limits; they do not create them.
On a drawing, the limits are usually the direct translation of a tolerance. A bilateral callout such as 25.0 ± 0.1 mm gives an upper limit of 25.1 and a lower limit of 24.9. A unilateral requirement — a minimum wall thickness, a flatness value — sets only one boundary.
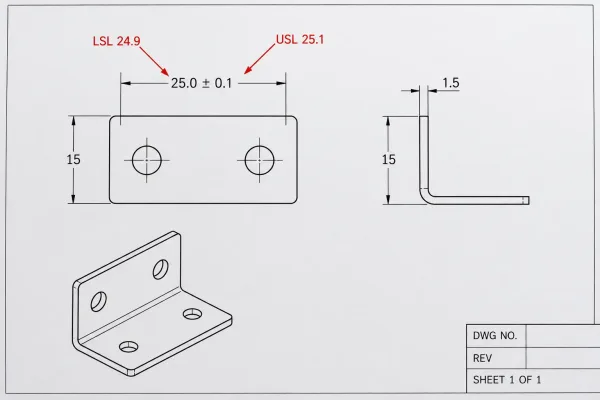
A dimension callout of 25.0 ± 0.1 mm translated into an upper specification limit of 25.1 and a lower limit of 24.9.
Tightening a tolerance therefore makes a precise request to the process: its variation must fit inside a narrower band. If the band is tighter than the equipment can hold, inspection cannot make the process capable — only a different process, tighter control, or a revised tolerance will.
Why Capability Requires a Stable Process
A capability number is only meaningful when the process is stable — in statistical terms, in control: output fluctuates within predictable bounds, with no drift, trends, or jumps between operating states.
The reason is practical. If a process wanders — a fixture loosens, tooling wears, a new material lot behaves differently — one data set averages together states that will not repeat, and the index describes a process that no longer exists. Collect data only from a period control charts show as stable, and treat any shift as a reason to re-run the study.
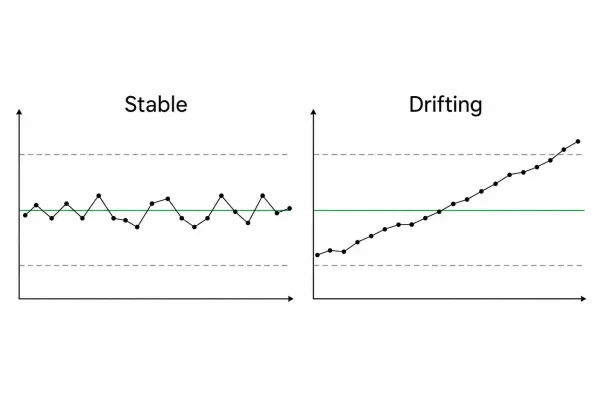
Left: a stable process stays within predictable bounds. Right: a drifting process trends out of bounds over time.
Stable does not mean conforming. A perfectly stable process can produce parts outside the limits on every cycle if its spread is too wide or badly centered. Stability tells you the number is trustworthy; capability tells you whether the answer is good.
How Cp and Cpk Relate to Capability
Two indices carry most of the conversation, and both are ratios built from the two ingredients above: process variation and specification limits.
Cp compares the width of the specification range to the natural spread of the process — conventionally six standard deviations, the interval covering almost all output of a stable, normally distributed process. It asks one question: is the variation narrow enough to fit the limits, assuming the process is centered between them?
Cpk adds the question of position. It measures the distance from the process average to the nearest specification limit and compares that distance to the same natural spread. A narrow spread still risks running off one side if the process is not centered — Cp looks fine while Cpk exposes the problem.
The relationship is straightforward: Cpk can never exceed Cp, and the gap between them is the cost of off-center running. The difference is easiest to see side by side:
| Index | Compares | Accounts for centering? |
|---|---|---|
| Cp | Specification width vs. process spread (6σ) | No |
| Cpk | Margin from average to the nearest limit vs. process spread (3σ) | Yes |
Values below 1.0 mean part of the spread lies outside the limits; a Cpk of 1.33 is a widely used minimum for series production, with tighter requirements for critical characteristics. What matters here is the structure: every capability index is a ratio between what the drawing allows and what the process does.
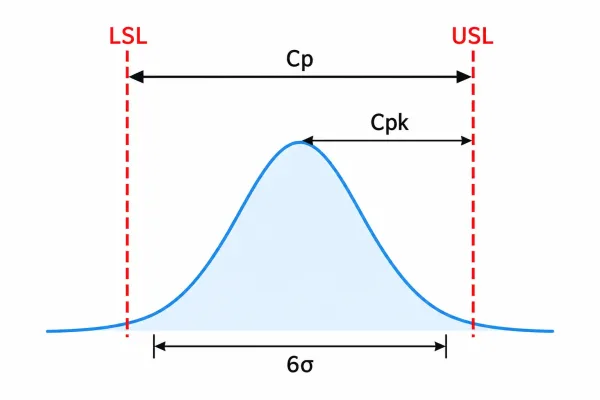
Cp compares specification width with the natural 6σ spread; Cpk adds the distance from the process average to the nearest limit.
What Process Capability Does Not Tell You
A capability index is not an inspection score. It does not record how many parts passed; it estimates what fraction will fall outside the limits if the process continues as measured. A past lot can be 100% inspected and perfect while the process behind it is entirely incapable.
It is also not a verdict on a sample. First-article and prototype parts are produced in small numbers under extra attention and adjusted settings. Those measurements describe a specially managed run, not routine production. Treating sample success as capability evidence is one of the most common mistakes in low-volume sourcing.
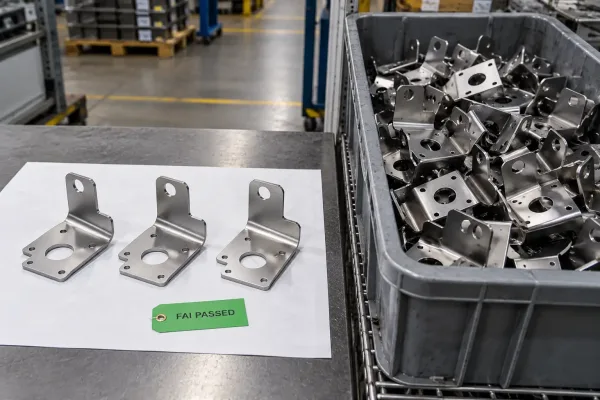
First-article parts validated under extra attention on the left, compared with parts from routine production on the right.
Nor does a capable index mean zero defects. Capability expresses probability, not guarantee: a small tail of the distribution can still land outside the limits. Every figure is only as valid as the period behind it — change the material supplier, replace tooling, or alter the sequence of operations, and the previous number no longer describes your process.
Using Capability Data When You Source Parts
For buyers and engineers, the value of capability data depends on how the request is framed. A vague demand for “high Cpk” produces vague reports; a request tied to specific characteristics and conditions produces evidence you can act on.
The following habits keep the conversation concrete:
- Name the characteristics. Ask for capability data only on tolerances that matter to function or assembly — critical hole positions, sealing surfaces — rather than every dimension.
- State the data conditions. Request data from routine production over a stable period, with sample size and method noted — not from setup shots or first articles.
- Match data to lot decisions. Evidence from one production period supports decisions about that period; re-check after material or tooling changes.
- Set realistic expectations for low volumes. Short custom runs often lack enough parts to estimate variation statistically. There, process control evidence — setup verification, in-process checks, documented inspection — is a more honest substitute than a headline index.
All of it comes back to one discipline: evaluate capability against the drawing, from production data, for the characteristic you actually care about.