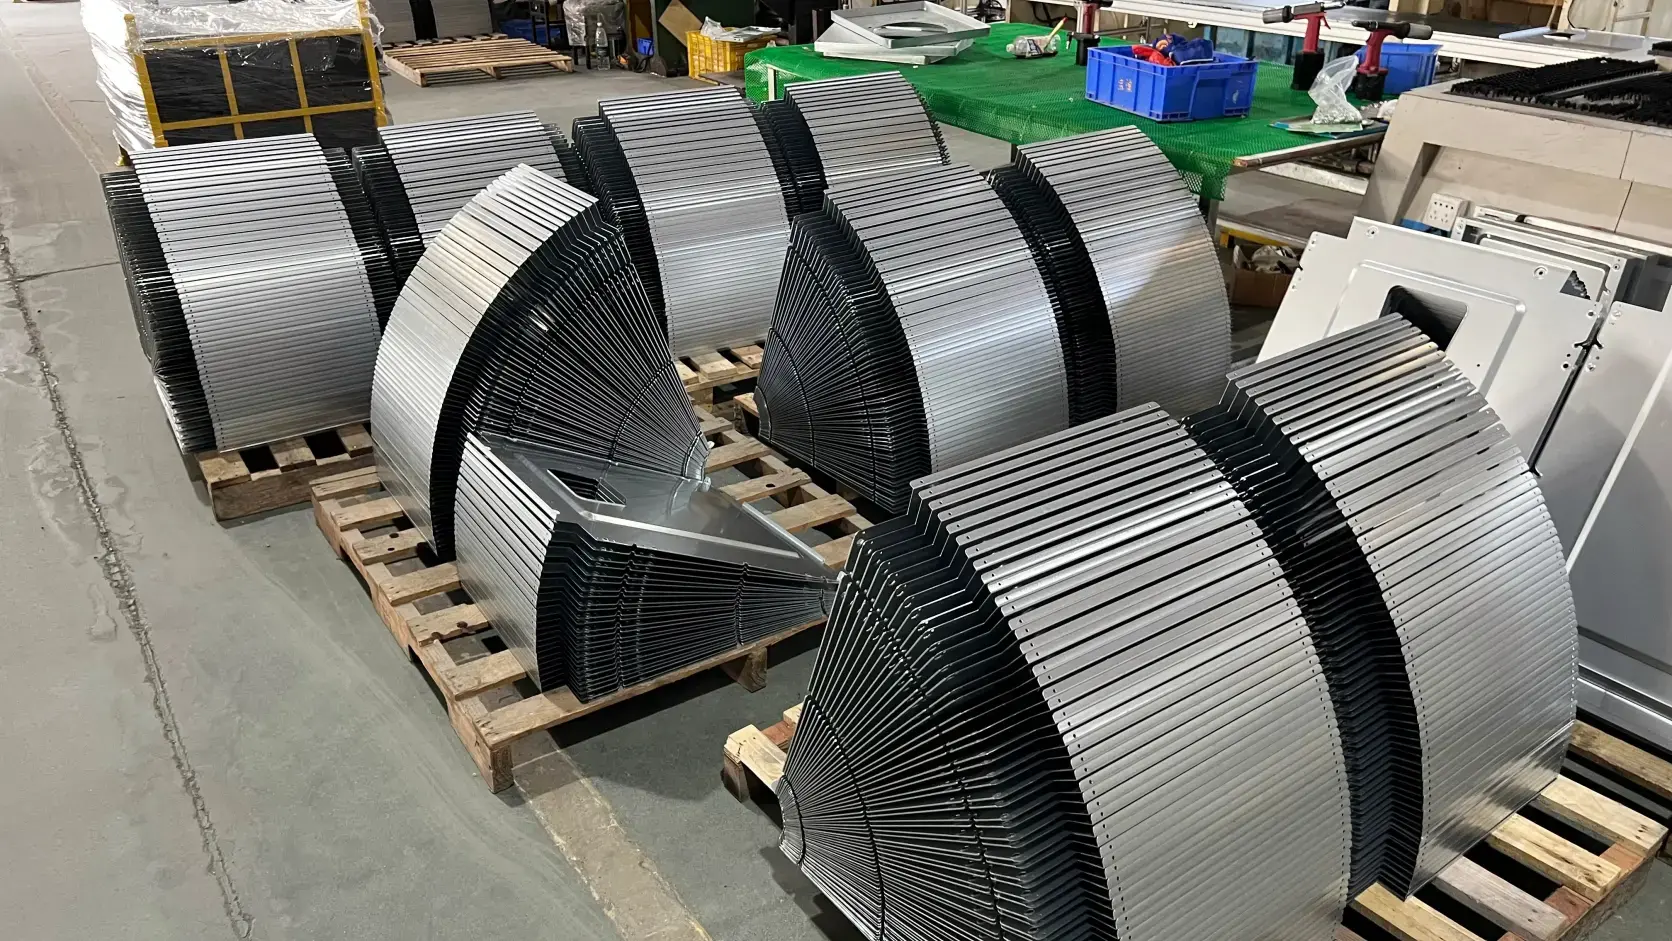

Surface texture refers to the local deviations in a manufactured part’s surface from its ideal geometric form. Engineers specify it on drawings, manufacturers control it during production, and inspectors verify it before shipment. Understanding surface texture helps you make better design decisions, avoid unnecessary costs, and ensure your parts perform as intended.
What Is Surface Texture?
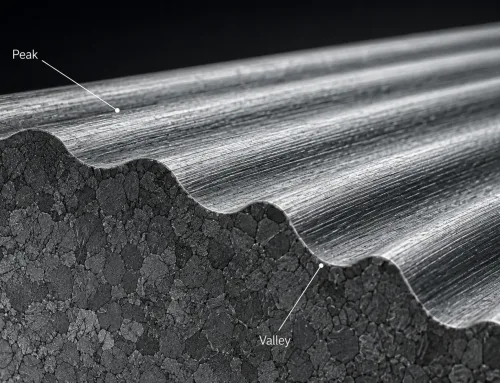
Surface texture is the repeated or random deviations from the nominal surface of a part. It encompasses all the fine-scale geometric features left by manufacturing processes—cutting marks from a tool, grain patterns from rolling, or peaks and valleys from grinding.
In engineering practice, surface texture is not a single number but a layered description of how a surface deviates from its ideal shape at different spatial frequencies.
The International Organization for Standardization defines surface texture in the ISO 21920 series (which replaced the earlier ISO 4287 and ISO 1302 standards). In North American practice, ASME B46.1 covers surface texture measurement and ASME Y14.36 covers its specification on engineering drawings.
Surface Texture vs. Surface Finish: What’s the Difference?
The terms “surface texture” and “surface finish” are often used interchangeably, but they are not identical concepts.
Surface texture is the geometric characteristic of a surface—what you can measure with a profilometer or microscope. It is the objective, quantifiable description of peaks, valleys, lay direction, and waviness patterns.
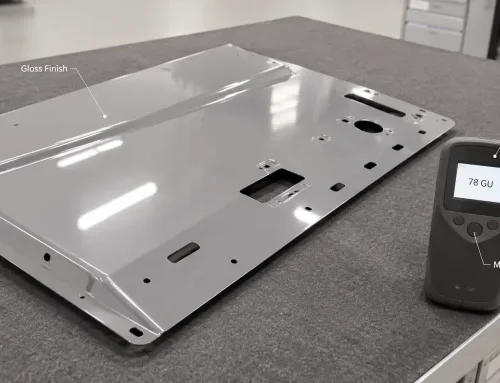
Surface finish (or surface quality) refers to the result of a manufacturing process applied to a surface. When an engineer specifies a “Ra 0.8 μm finish,” they are describing the target outcome. When they discuss “surface texture,” they are describing the measurable physical state of that surface.
In practical terms, you control surface texture through your choice of manufacturing process and parameters. You specify the desired surface finish on the drawing. The two concepts overlap, but surface texture is the broader, more precise engineering term.
The Three Components of Surface Texture
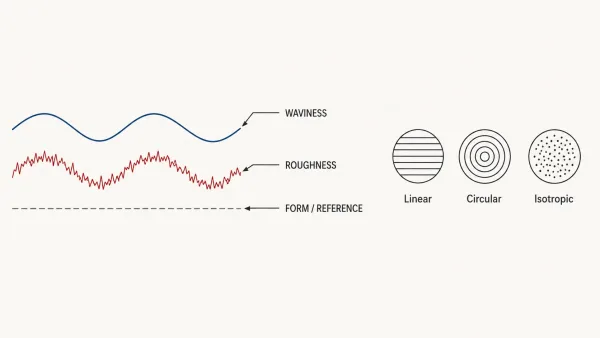
A cross-sectional profile diagram separating a manufactured surface into three components—roughness (fine irregularities), waviness (longer-wave undulations), and overall form—along with a top-view showing lay direction patterns for linear, circular, and isotropic surfaces.
Surface texture is not a single attribute. It is composed of three distinct components, each describing surface deviations at a different spatial scale.
Roughness
Roughness is the finest and most closely spaced component of surface texture. It consists of the small, irregular peaks and valleys produced by the cutting tool, abrasive grain, or laser beam that shaped the surface. Roughness spacing is typically measured in fractions of a millimeter.
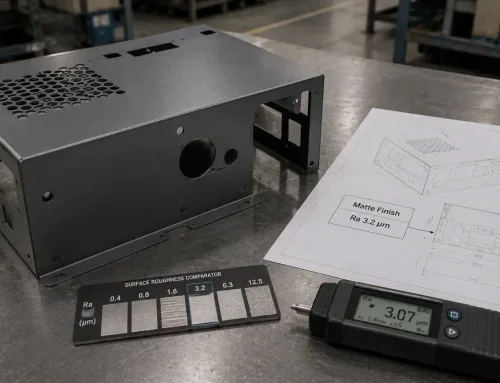
Roughness is the component engineers specify most often on drawings, usually as an Ra (arithmetic average roughness) value. A machined surface with Ra 1.6 μm has finer, more closely spaced irregularities than one with Ra 6.3 μm.
Waviness
Waviness is the longer-wavelength component of surface texture. It results from factors like machine tool vibration, workpiece deflection during cutting, or thermal distortion during welding. Waviness has a longer spacing than roughness—typically in the range of millimeters to tens of millimeters.
A surface can have low roughness but high waviness. For example, a part ground to Ra 0.4 μm may still show visible waviness if the grinding wheel oscillated during the pass. Waviness matters for sealing surfaces and bearing applications where long-wave deviations can cause leaks or uneven load distribution.
Lay
Lay is the direction of the dominant surface pattern. It reflects the direction of the primary machining or forming operation. A turned cylindrical surface has a circular lay. A milled flat surface has a linear lay parallel to the cutter path. A bead-blasted surface has an isotropic lay—no dominant direction.
Lay affects how a surface performs under sliding contact, how coatings adhere, and how light reflects from the surface. Engineers sometimes specify lay direction on drawings when the orientation of surface marks is functionally important—such as on sealing surfaces where lay should be perpendicular to the direction of potential leakage.
Key Surface Texture Parameters
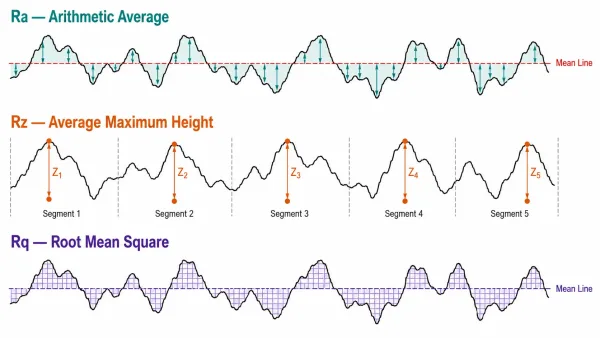
A single surface profile line is shown three times to illustrate how Ra measures the average deviation, Rz measures the peak-to-valley height over five sampling lengths, and Rq measures the root mean square deviation—each highlighted with distinct color-coded annotations.
Several parameters quantify surface texture, but three appear most frequently on engineering drawings and in quality inspection reports.
| Parameter | Name | What It Measures | Common Use |
|---|---|---|---|
| Ra | Arithmetic Average Roughness | The average absolute deviation from the mean line | Most widely specified; general-purpose roughness indicator |
| Rz | Average Maximum Height | The average height difference between the five highest peaks and five deepest valleys over the evaluation length | Sensitive to isolated peaks and valleys; used for bearing and sealing surfaces |
| Rq | Root Mean Square Roughness | The root mean square of deviations from the mean line | Statistically more stable than Ra; used in research and vibration-sensitive applications |
Ra is the default choice for most drawings because it is well understood, easy to measure, and supported by all major standards. Rz gives a better picture of extreme surface features that Ra might average out. Rq is mathematically more robust but less commonly specified in manufacturing practice.
A practical guideline: if your drawing currently specifies only Ra and you are seeing issues with isolated scratches or deep tool marks that pass inspection, consider adding an Rz requirement alongside the Ra specification.
How Manufacturing Processes Affect Surface Texture
Every sheet metal fabrication process leaves its own signature on the surface. Understanding this helps you choose the right process for your surface texture requirements—and avoid specifying finishes that are unnecessarily expensive or physically unachievable.
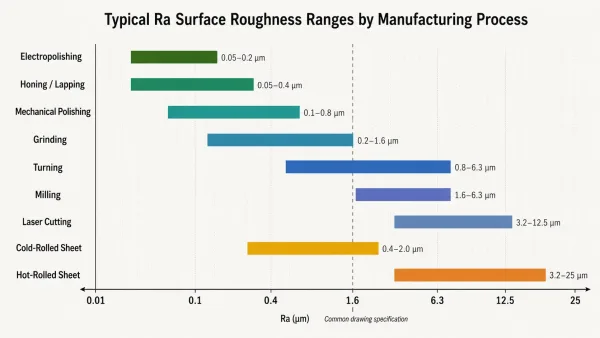
A horizontal bar chart displaying the achievable Ra roughness ranges for common manufacturing processes—including hot-rolled, laser cutting, milling, turning, grinding, polishing, and electropolishing—showing how each step progressively refines surface texture.
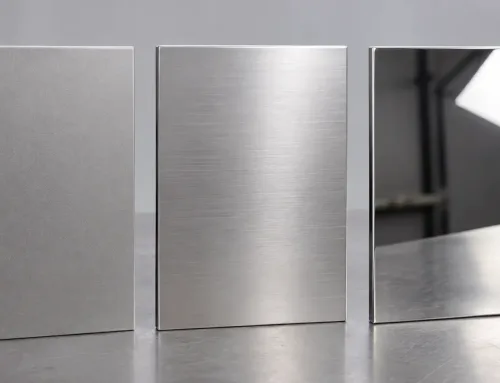
Raw material surfaces. Cold-rolled steel sheet typically arrives with Ra 0.8–1.6 μm. Hot-rolled steel is rougher, around Ra 3.2–12.5 μm. Stainless steel in 2B finish is approximately Ra 0.1–0.5 μm, while No. 4 (brushed) finish is around Ra 0.2–1.0 μm. The starting surface sets a baseline that subsequent operations can only modify, not fully erase.
Cutting processes. Laser cutting produces edge surfaces of approximately Ra 3.2–6.3 μm, with a thin heat-affected zone. Waterjet cutting leaves a slightly rougher edge (Ra 3.2–12.5 μm) with no thermal damage. Plasma cutting creates the roughest edges, typically Ra 12.5–25 μm. Shearing and punching produce clean-cut and fracture zones with different roughness levels on the same edge.
Forming and bending. Press brake bending can leave tool marks on the bend radius, especially with worn tooling. The inner radius typically shows compressive texture changes, while the outer radius may develop micro-cracking at tight bend ratios. Roll forming produces a more uniform surface but can introduce waviness from roller deflection.
Welding. MIG and TIG welding create weld beads with roughness that depends on operator skill, wire feed rate, and shielding gas. Laser welding produces a smoother, narrower weld with less heat-affected zone distortion. All welding processes can introduce oxidation discoloration on adjacent surfaces that affects both appearance and subsequent coating adhesion.
Sheet metal finishing processes can further modify surface texture. Grinding can achieve Ra 0.2–0.8 μm. Mechanical polishing reaches Ra 0.05–0.4 μm. Electropolishing on stainless steel can produce Ra < 0.1 μm. Bead blasting creates an isotropic surface with Ra 0.8–3.2 μm, depending on media size and pressure.
Each post-processing step adds cost, so specifying the finest finish your part actually needs—not the finest one available—is good engineering practice.
How to Specify Surface Texture on Engineering Drawings
Clearly defining sheet metal surface requirements on the drawing avoids ambiguity, reduces back-and-forth communication, and helps prevent parts from being made to the wrong standard.
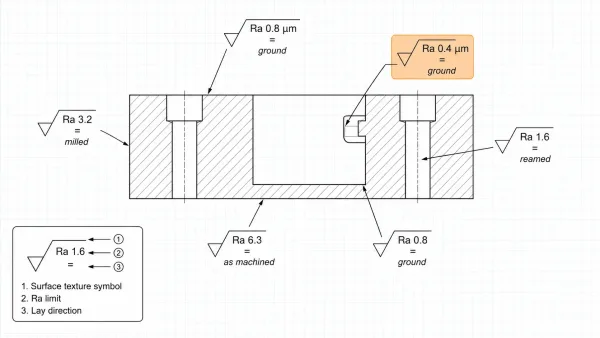
A portion of a simplified engineering drawing showing a machined part cross-section with ISO surface texture symbols placed on different surfaces, each annotated with Ra values, lay direction arrows, and processing method notes, demonstrating how surface requirements appear on an actual drawing.
Under ISO 1302 and the updated ISO 21920-1:2021, the basic surface texture symbol consists of two lines forming a V-shape with a horizontal line added at the vertex. The symbol is placed on the surface being specified, with the Ra value and any additional requirements written to the right of the symbol.
Common specification elements include:
- Ra value with unit (e.g., Ra 1.6 μm or Ra 63 μin)
- Sampling length (evaluation length) when it differs from the default
- Lay direction symbol (e.g., = for parallel, ⊥ for perpendicular, × for crossed)
- Processing method (e.g., “milled,” “ground,” “blasted”) when the method must be specified
- Surface texture limits with “max” or a tolerance band when the range matters
Two common specification errors that increase manufacturing cost unnecessarily:
- Specifying Ra 0.8 μm on all surfaces when only sealing or mating surfaces require it. Unnecessary precision on non-functional surfaces adds grinding or polishing cost with no performance benefit.
- Not specifying the evaluation length. A short evaluation length can give a misleadingly low Ra value. If your application is sensitive to waviness, specify a longer evaluation length or add a waviness parameter.
A practical recommendation: work with your manufacturer to determine which surfaces genuinely need controlled texture. On most sheet metal and machined parts, only 20–30% of surfaces are functionally critical. Specify those precisely and leave the rest as “as-machined” or “as-formed.”
Why Surface Texture Matters for Part Performance
Surface texture is not an abstract measurement—it directly affects how your parts perform in service.
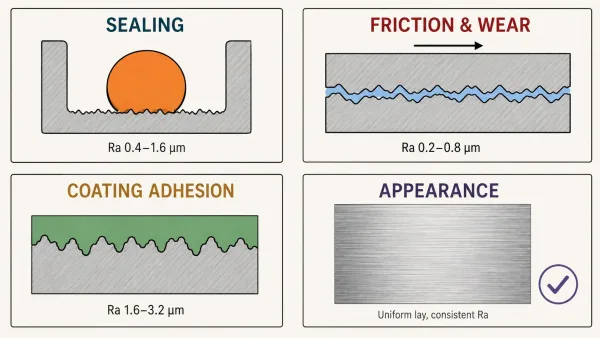
Four illustrated cross-section panels demonstrate how surface roughness influences sealing contact with an O-ring, sliding friction between two surfaces, mechanical adhesion of a coating layer, and visual uniformity of a brushed metal surface.
Sealing. Gasket and O-ring surfaces require controlled roughness to maintain a reliable seal. Too rough, and the seal cannot bridge the surface irregularities, leading to leakage. Too smooth, and O-rings may stick or experience excessive friction during assembly. For most elastomeric seals, Ra 0.4–1.6 μm is the practical range. For metal-to-metal seals, even finer control is needed.
Friction and wear. Surfaces in sliding contact need a roughness level that balances low friction with adequate lubricant retention. A surface that is too smooth may experience adhesive wear (galling), while one that is too rough increases abrasive wear. Bearing surfaces typically specify Ra 0.2–0.8 μm depending on the bearing material and lubrication method.
Coating adhesion. Paint, powder coat, and plating adhere better to surfaces with slight roughness that provides mechanical “tooth.” A blasted or chemically etched surface with Ra 1.6–3.2 μm typically gives the best coating adhesion. Electropolished surfaces, while visually attractive, may require additional surface preparation before coating.
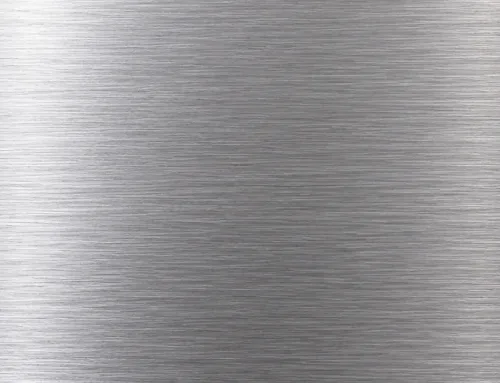
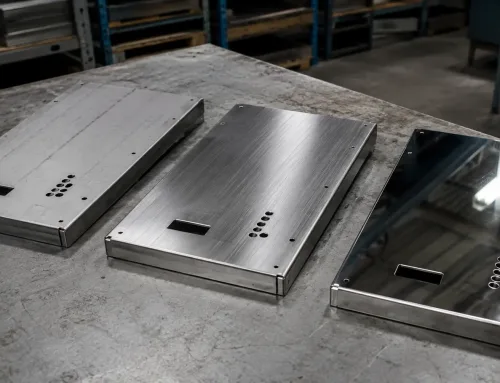
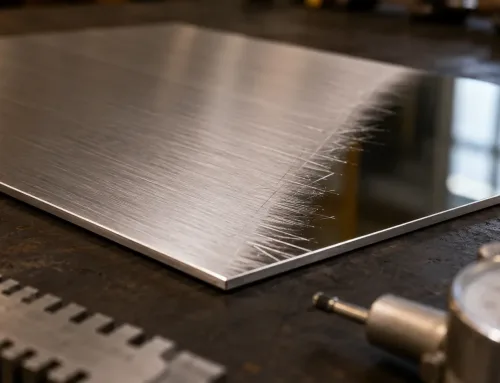
Appearance. Consumer-facing parts in electronics, medical devices, and architectural applications require consistent surface texture for visual quality. Brushed stainless steel (No. 4 finish) must show uniform, parallel lines without visible waviness or scratches. Surface texture consistency across multiple parts in an assembly is often more important than the absolute roughness value.
FAQs
This article is for informational purposes only. Surface texture requirements vary by application, material, and manufacturing process. Consult your manufacturer or a qualified surface metrology specialist to determine the appropriate specifications for your specific parts.